Today, the SP500 started off continuing yesterday's slide. This reversed shortly after noon, and the ensuing move up retraced just about 2/3 of the drop from the high late Tuesday afternoon. Cycles within cycles.
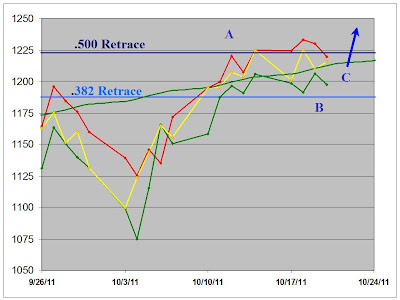
Taking a somewhat longer view, here is an updated close up of the first graph from last Thursday.
The daily highs. lows, and closings are in red, green, and yellow, respectively. For the last 9 or 10 days, the movement has been sideways, and mostly contained between the .382 and .500 retracement levels of the drop from the May 2 high to the October 4 low. Evidently this stage of the correction is tracing out some sort of flat. This implies that a new recovery high will be achieved before the next down wave begins. For what it's worth, these moves have also been hugging the continuation of the former lower boundary of the up-slanting August-September trading channel.
Something will have to break soon

No comments:
Post a Comment